


What information is available
Land degradation in Uganda — chiefly soil erosion and soil fertility depletion — is a serious problem. Through MAAIF and NARO, the SLM programme generates land use and soil information to identify where the problem is most severe and to track whether interventions are working.
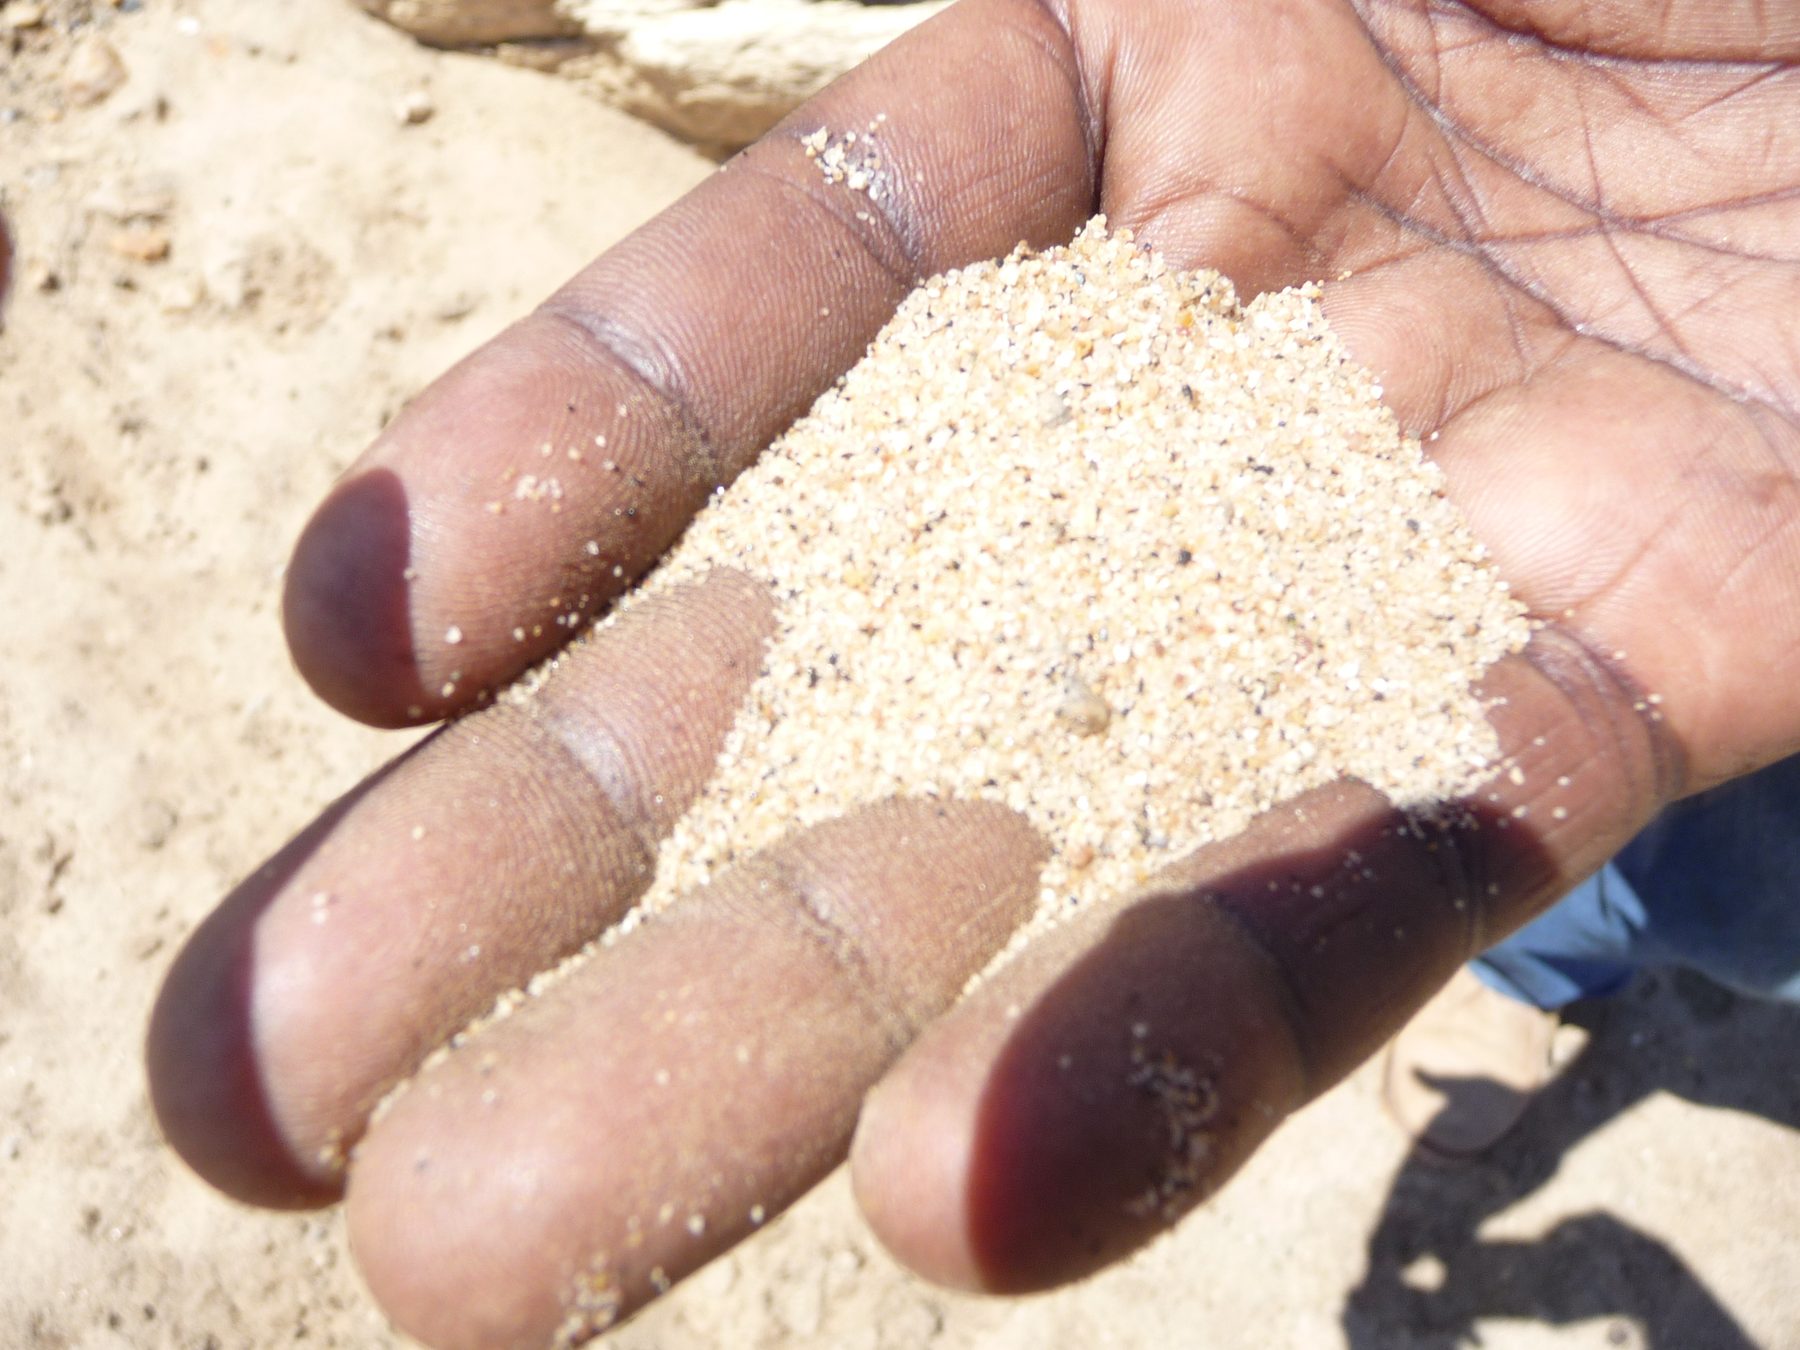
Uganda's soils vary widely by region: the fertile volcanic soils of the East and South-western Highlands support intensive cash-crop farming; the shallow, sandy soils of the Cattle Corridor are prone to erosion and better suited to pasture; the ferralitic, generally acidic soils of the Lake Albert Crescent sit atop thick sedimentary deposits; and the western zone (Rwebitaba) spans everything from highly weathered Ferralsols to young, nutrient-rich volcanic Andosols. Understanding these differences is central to matching the right SLM technology to the right landscape — see Zones & Hotspots for the full picture by agro-ecological zone.
Updating the national soil map
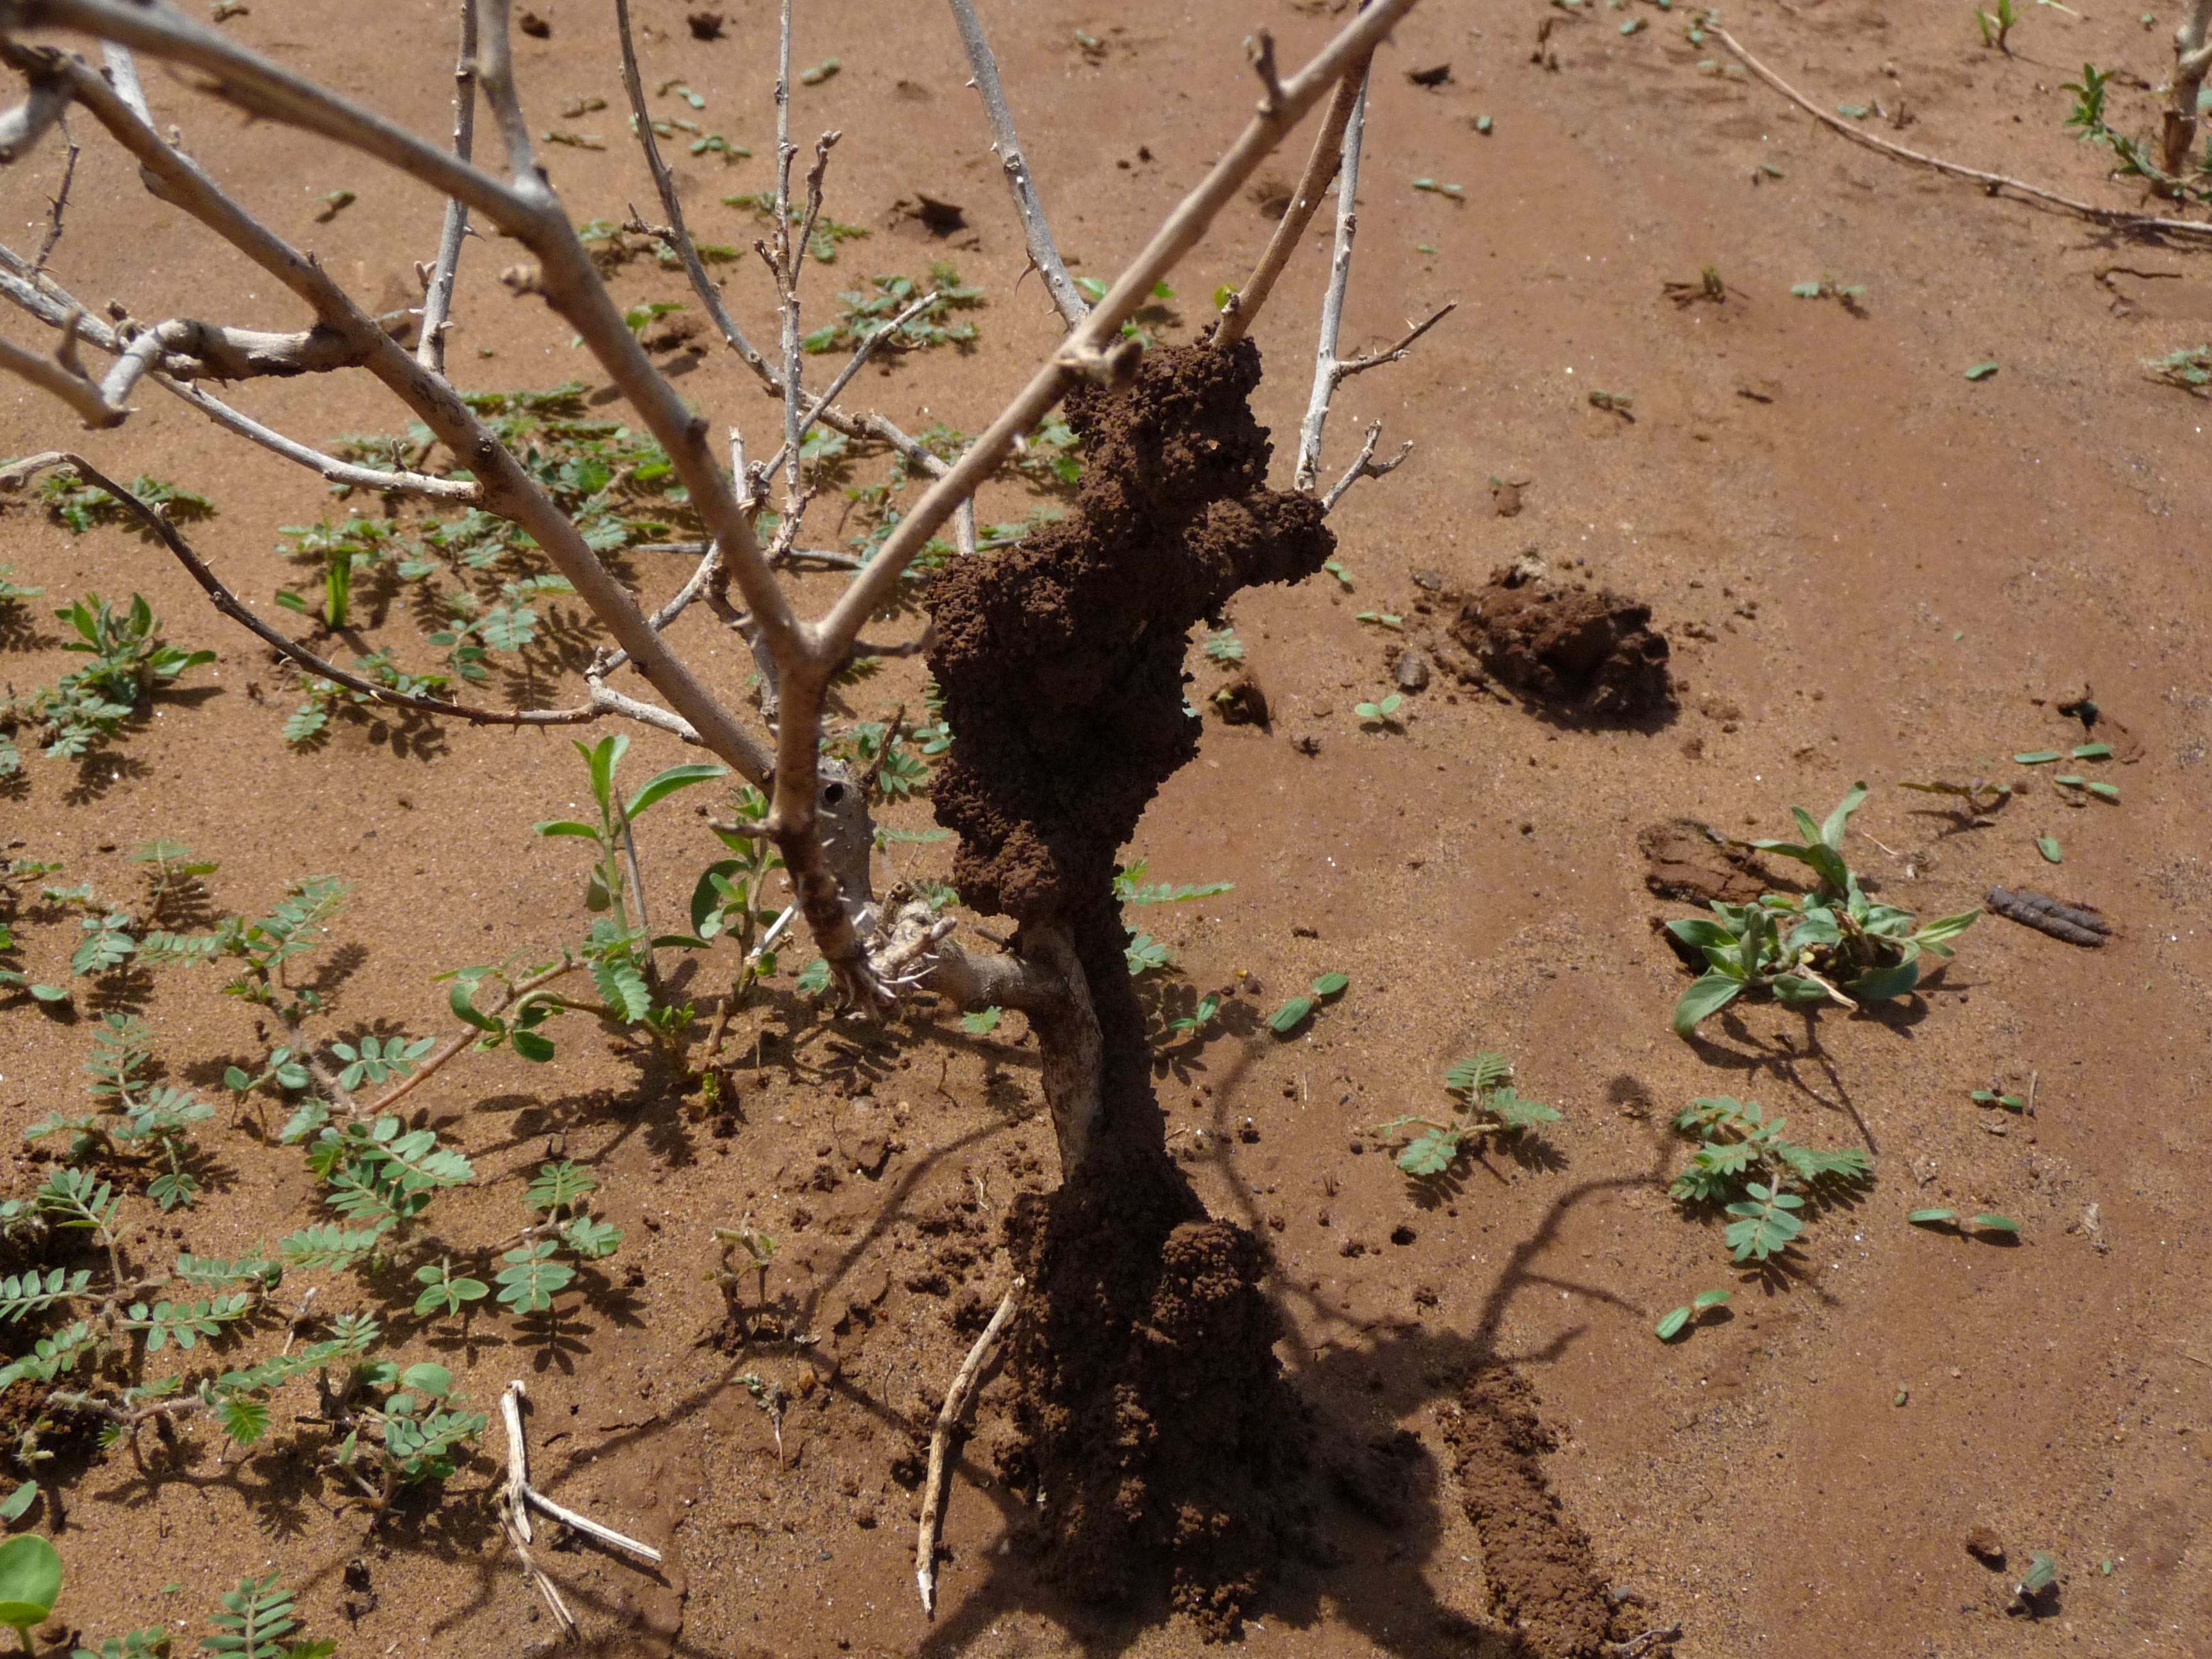
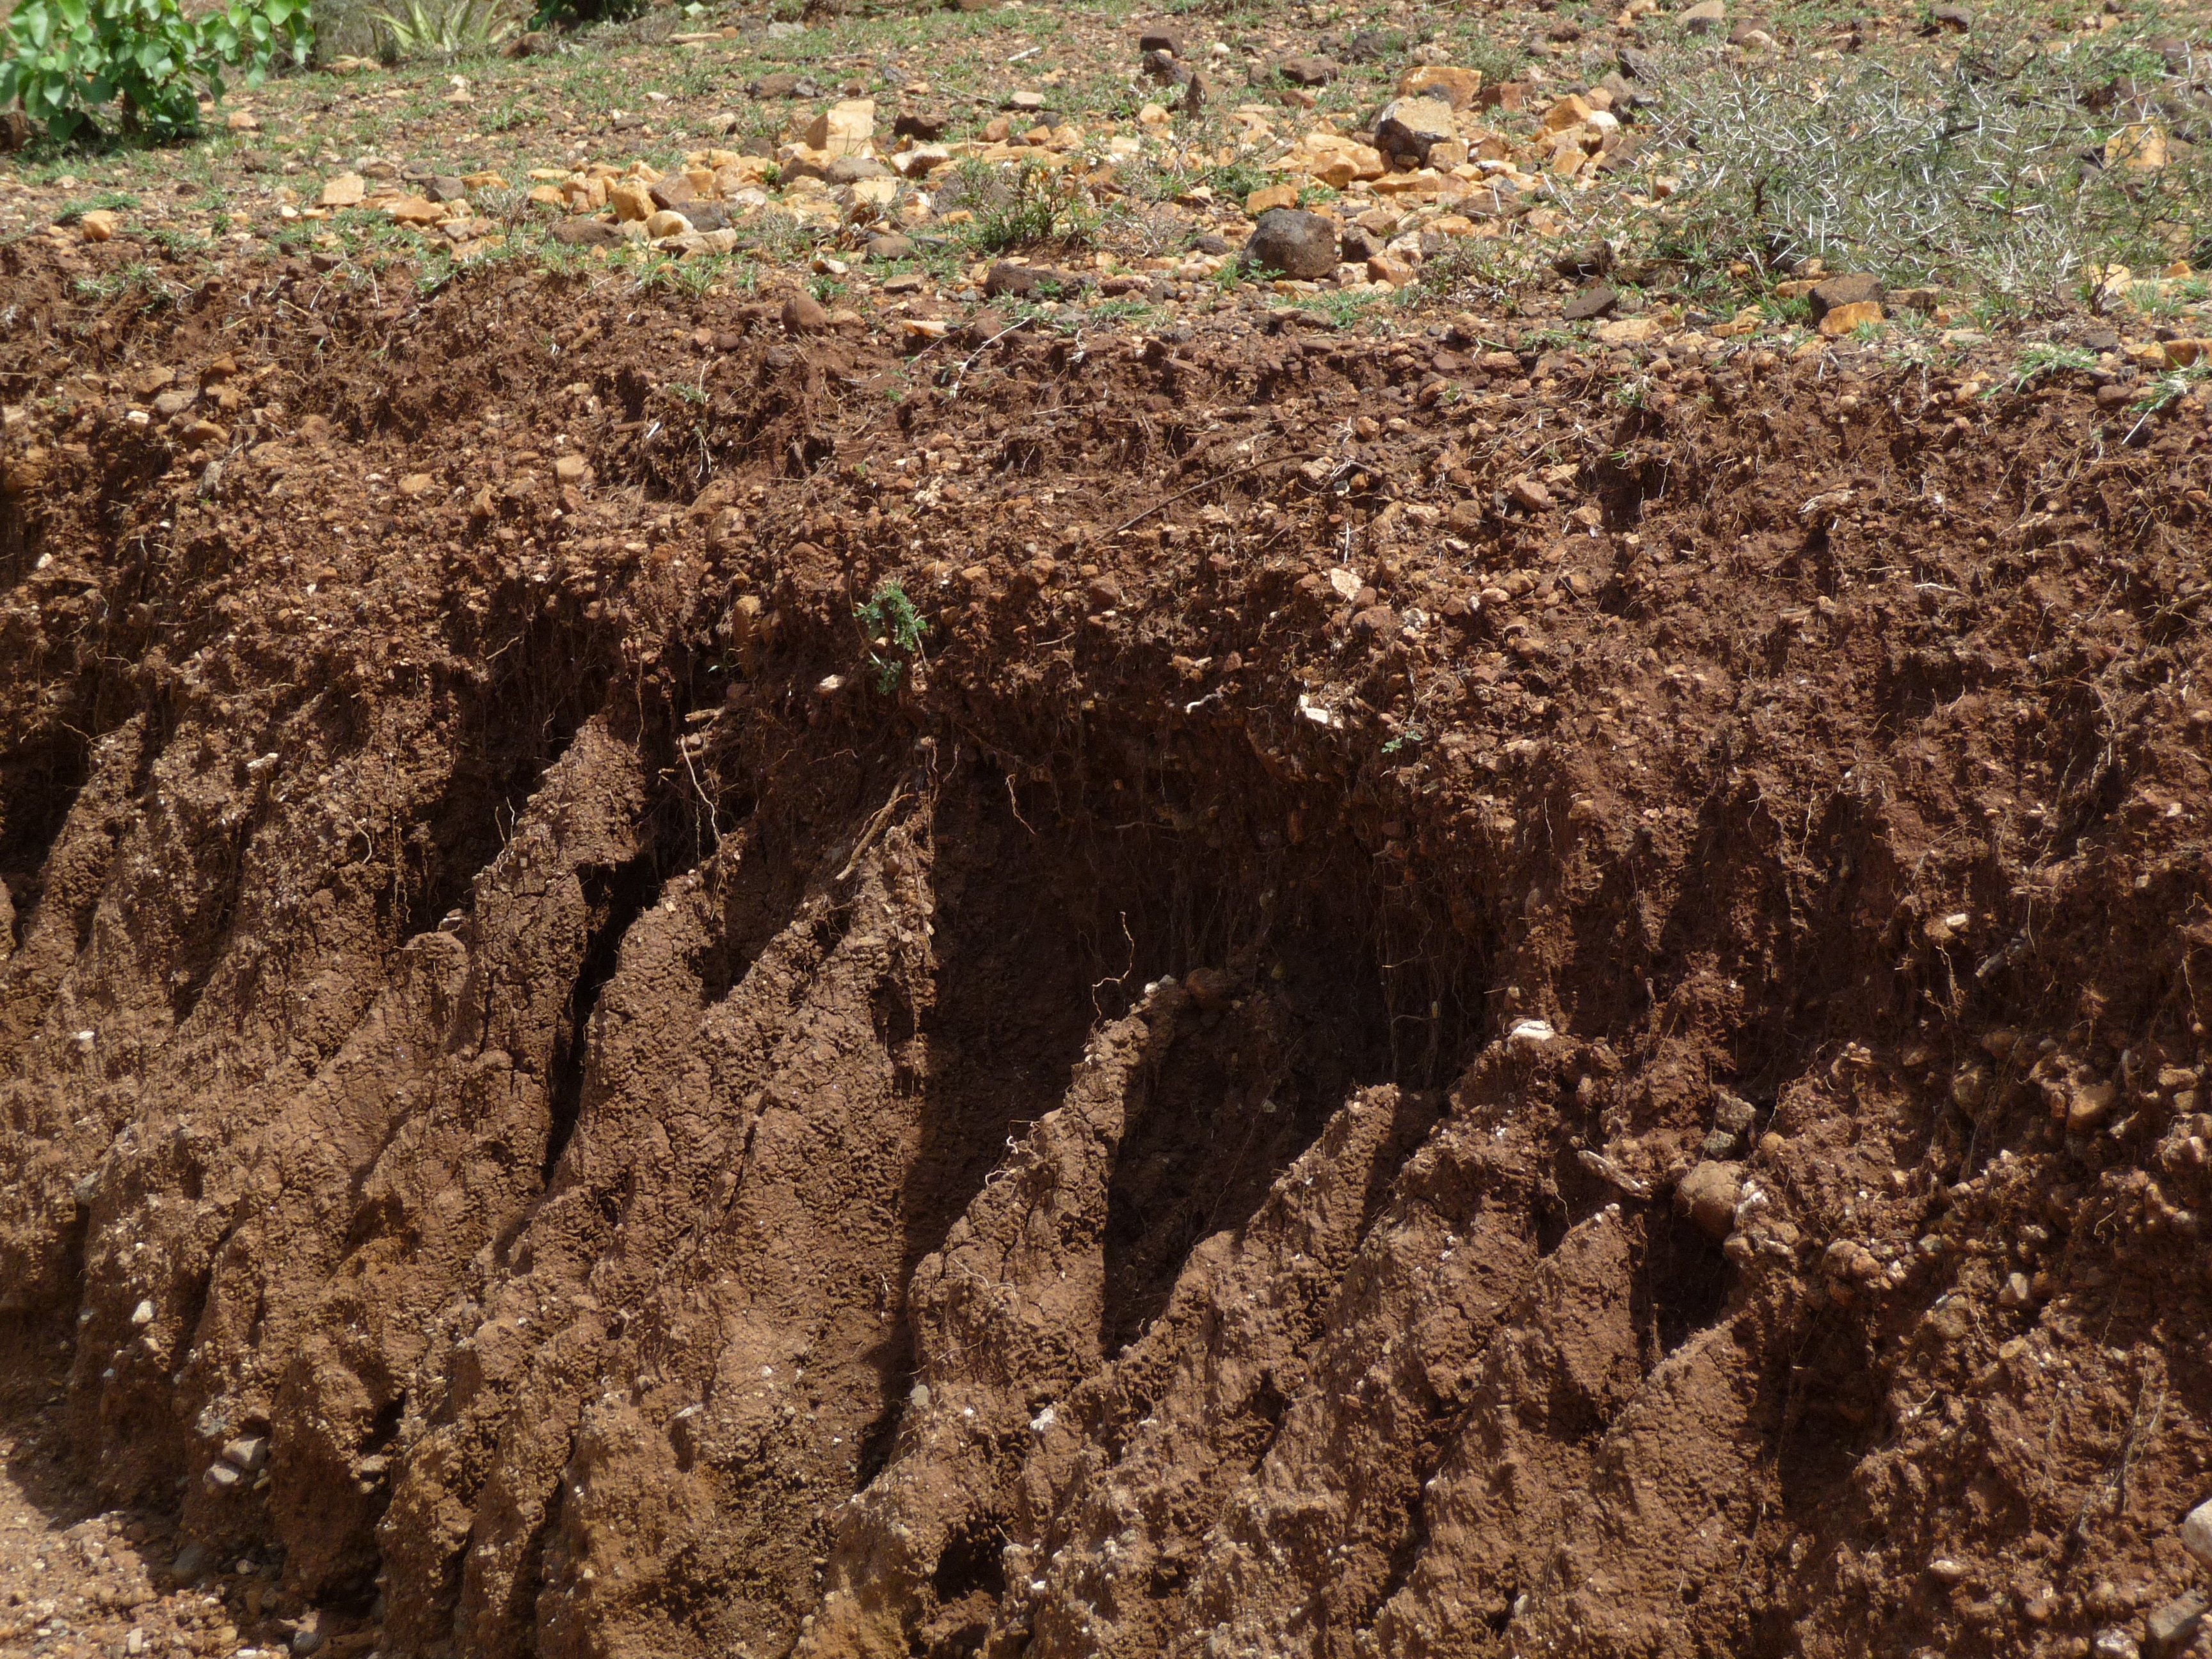
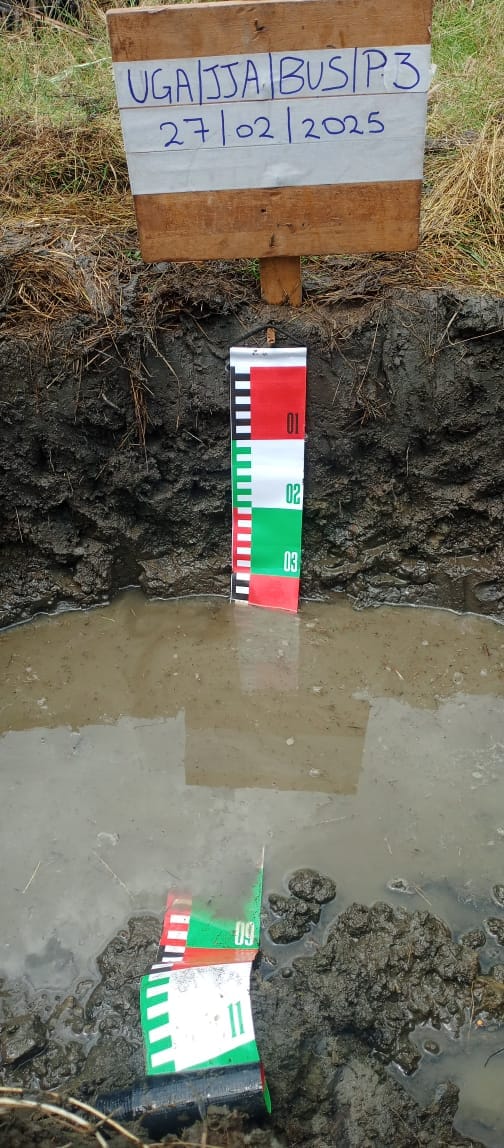
Uganda's first soils map, at a scale of 1:250,000, was developed in the late 1950s and remains, sixty years on, the most detailed nationwide map available — too coarse for farm-level use, and named by local place references that make cross-referencing difficult.
The SLM Project, under NARO and supported by the Global Environment Facility (GEF), is updating this to a more detailed 1:50,000 scale using World Reference Base (WRB) soil classification. Six of the 17 main mapping sheets — Masaka, Kampala, Kabale, Fort Portal, Mbarara and Jinja — have been surveyed so far, covering roughly 40% of the country; the Masaka sheet is complete, with the other five under processing.
Two companion products are also in development: the Uganda Soils Book and the Uganda Soils Information System, an online resource planned for slm.go.ug.
Mapping progress
Original map scale: 1:250,000 (1950s)
Target scale: 1:50,000, WRB classification
Sheets surveyed: 6 of 17 (Masaka, Kampala, Kabale, Fort Portal, Mbarara, Jinja)
Coverage so far: ~40% of the country
What the land-use studies show
Land use and soil carbon stocks
Studies on land use and soil carbon stocks show that, compared with other land uses, natural forests store the highest amount of soil carbon — 146 t/ha — meaning they can act as carbon sinks against the effects of climate change and warrant conservation. A nine-zone, 486-household survey is now tracking SOC stocks nationally — see Articles.
Erosion drivers
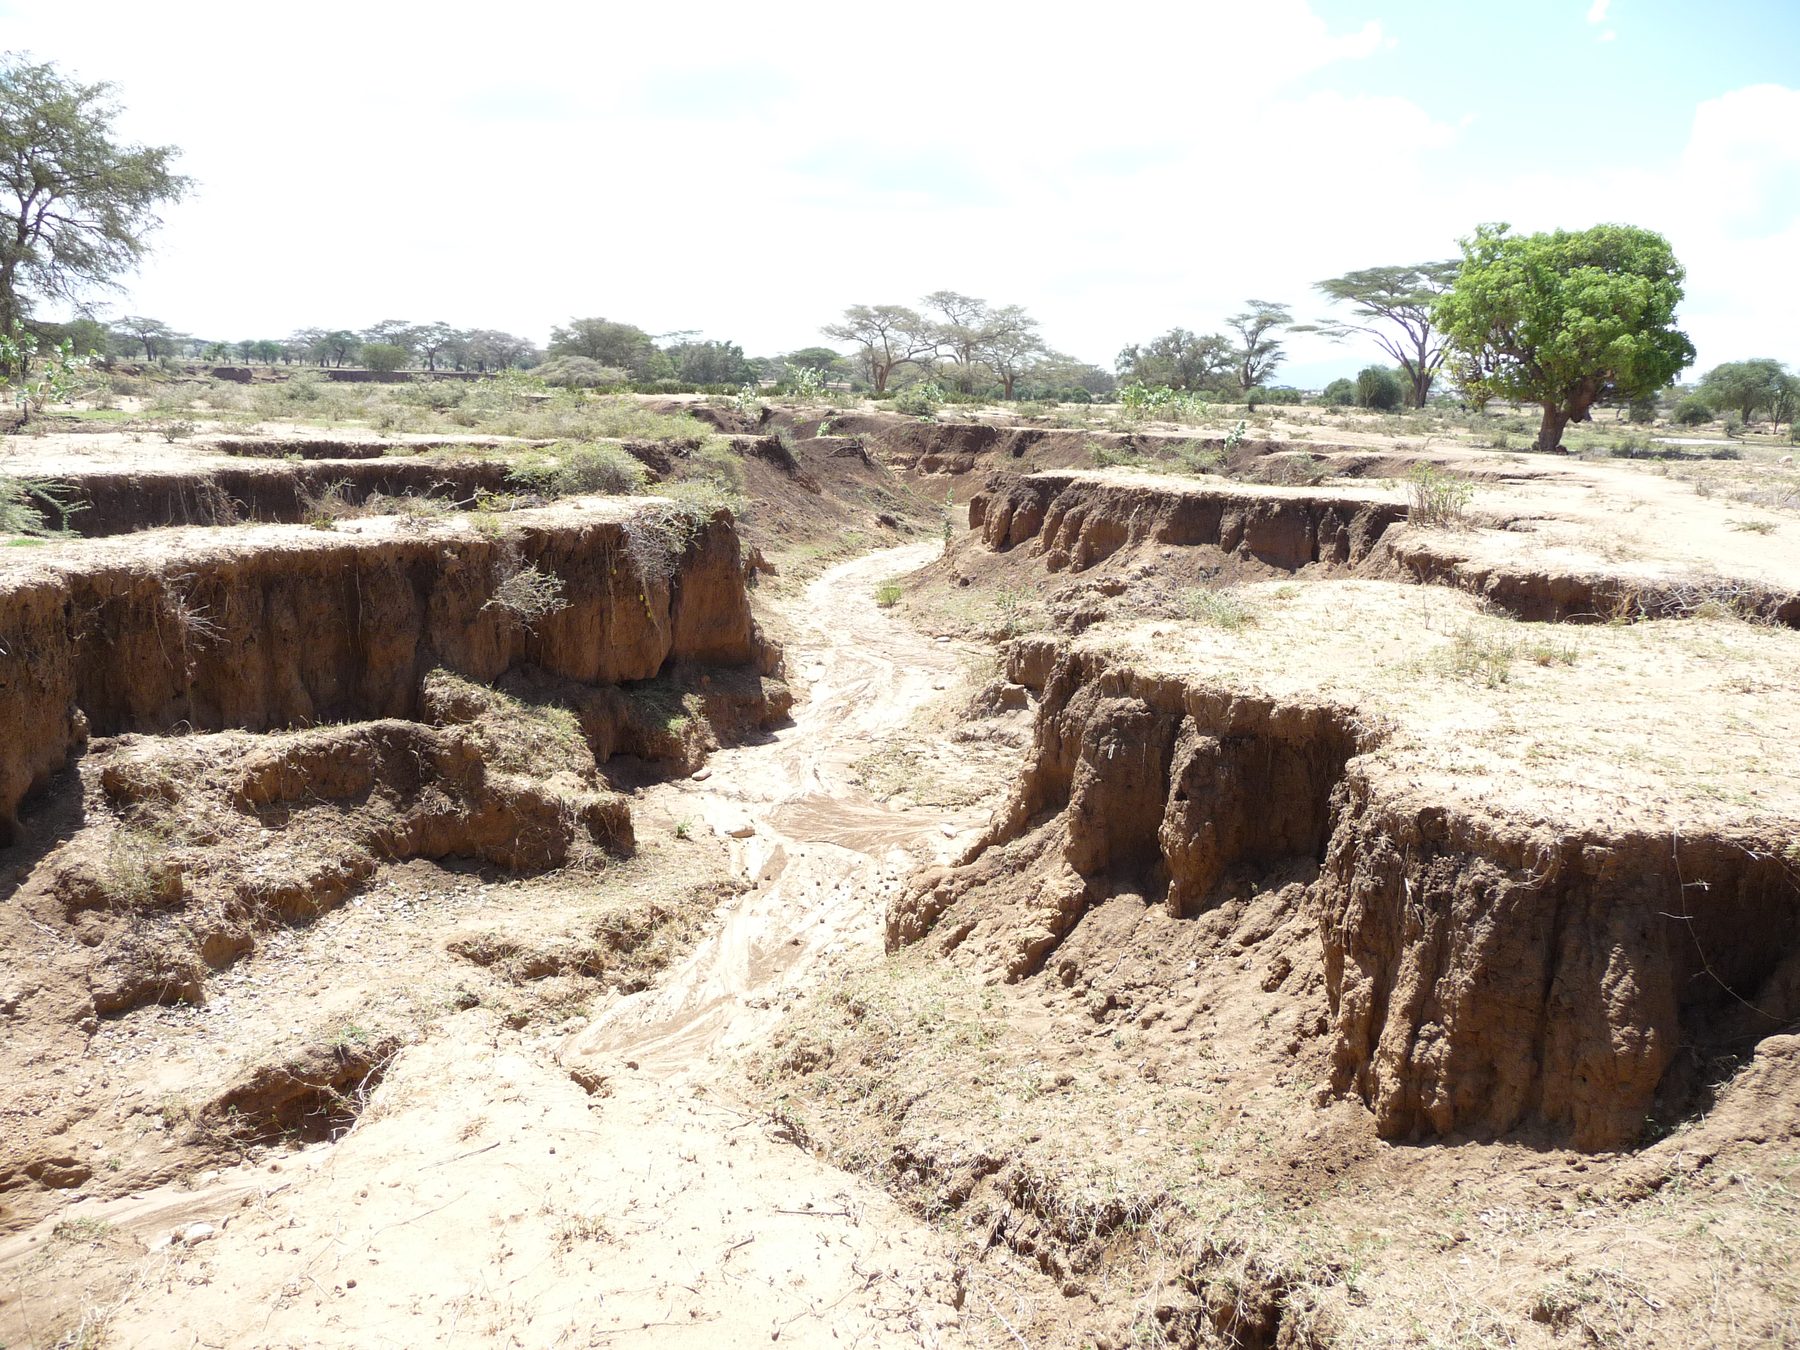
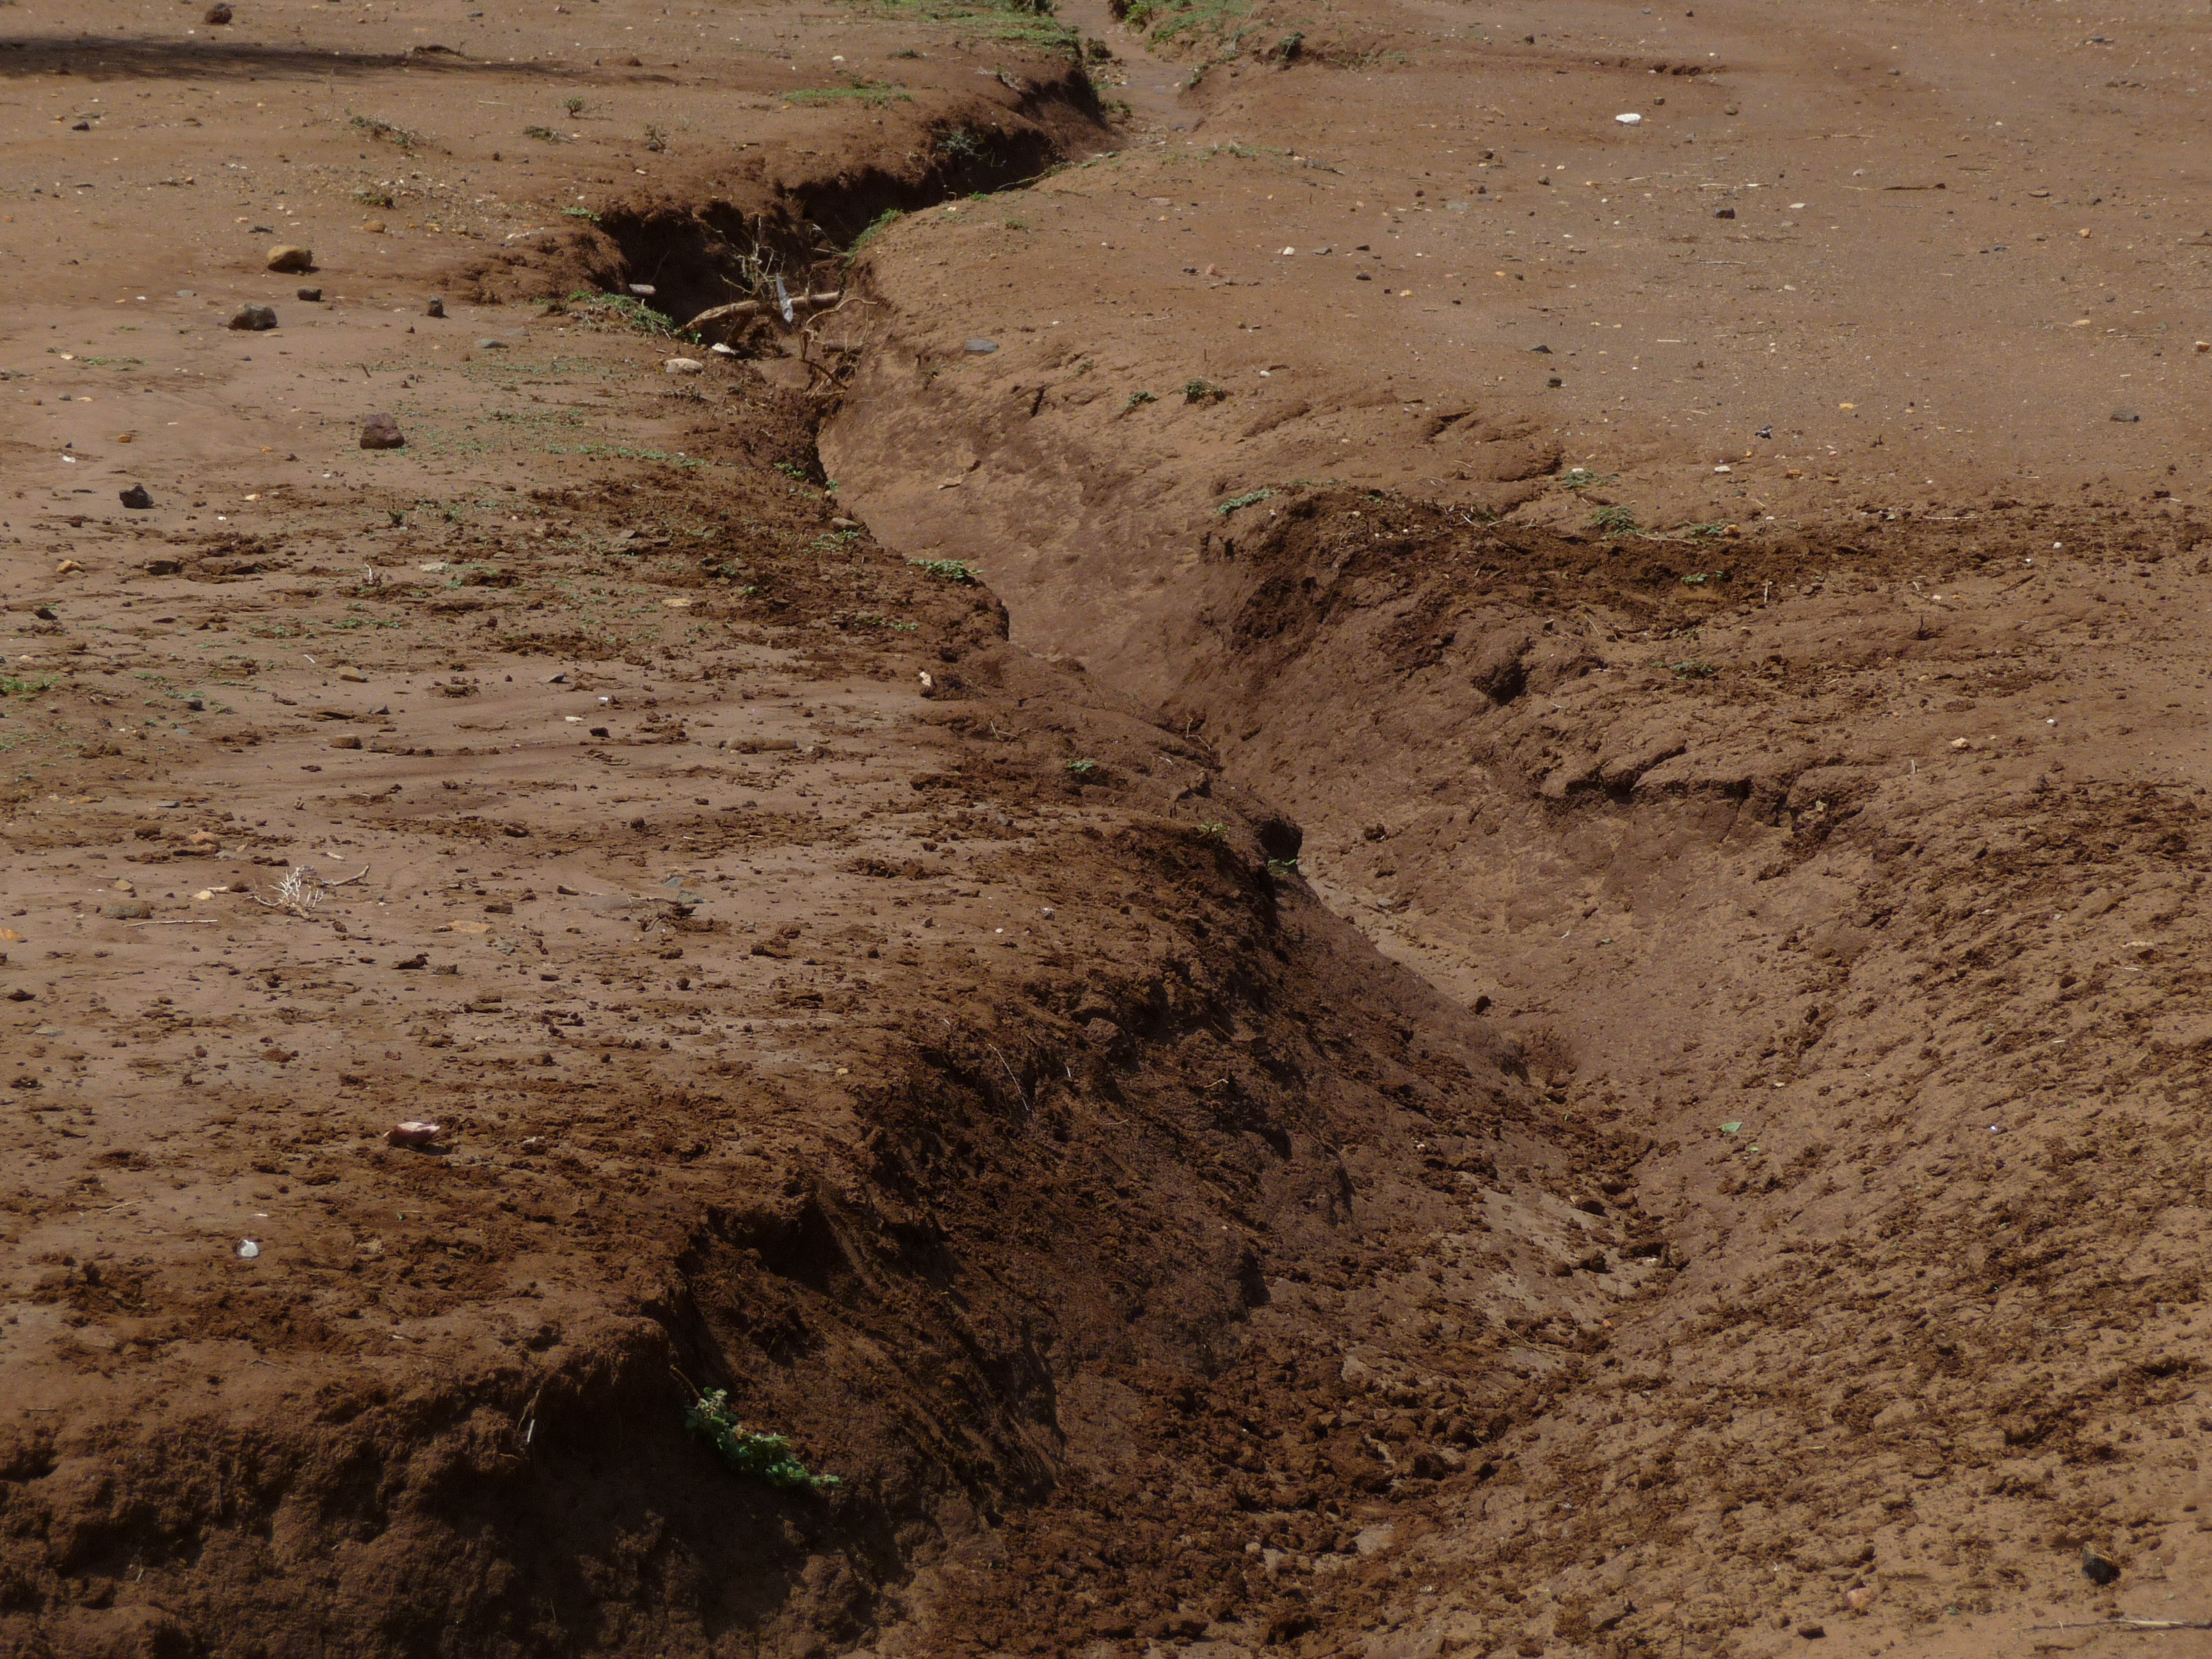
Flash floods and strong winds accelerate soil erosion, compounded by deforestation, overgrazing and other poor farming methods. In some areas cultivation extends to stream banks, causing siltation. In the highlands, steep slopes and heavy rainfall further intensify erosion risk.
Sandy, moisture-stressed soils
In drought-prone parts of the Cattle Corridor, sandy soils hold water poorly. Trials found that a Ca-bentonite amendment (2.5 t/ha) raised soil moisture and lifted maize, millet, sorghum, green-gram and groundnut yields above untreated plots by 11–20%, rising to 65–108% when combined with farmyard manure and inorganic fertiliser.
Vegetation & land cover change
Cropland already dominates land cover in the higher-pressure zones — 79% in Eastern Uganda and 58–59% in the Highlands and Lake Victoria Crescent — leaving little room for further lateral expansion. NDVI satellite analysis (2000–2017) and fire-occurrence mapping now track these shifts over time. See the Vegetation Change Trends article for the full zone-by-zone breakdown.
Products, coverage and access
| Product | Coverage | Custodian | Access |
|---|---|---|---|
| National soil map (1:50,000 update) | 6 of 17 sheets surveyed, ~40% of country | NARO | Open download / on request |
| Uganda Soils Book & Soils Information System | National (in development) | NARO | slm.go.ug, on release |
| Land degradation assessment | National, by district | NARO / MAAIF | On request |
| Rainfall / temperature hotspot maps | National, 4 rainfall zones | NARO | On request |
| Soil organic carbon stocks survey | 9 Agricultural Production Zones, 486 households | NARO / NARL Kawanda | See Articles for methodology |
| Vegetation & land cover change data | 5 SLM zones, national NDVI series 2000–2017 | NARL Kawanda GIS Lab | See Articles for the full breakdown |
| Agro-ecological zone profiles | Cattle Corridor, East & South-western Highlands, Eastern Uganda | NARO / SLM | See Zones & Hotspots |
The hotspot maps, soil carbon findings and land cover data are already documented; see Zones & Hotspots and Research & Projects for the underlying studies and downloadable articles.
Reading the maps
Soil and degradation maps typically classify land by severity of erosion or fertility loss, from stable to severely degraded, and by the dominant soil type — sandy, loamy, clay or volcanic. As a rule of thumb: sandy and shallow soils (common in the Cattle Corridor) call for moisture-retention practices like Ca-bentonite amendment or mulching; volcanic and clay-loam soils on steep terrain (the Highlands, Mount Elgon) call for erosion control such as terracing and agroforestry; and wetland-adjacent soils call for buffer zones and careful drainage management. These maps guide district-level decisions, not individual farm plans — a site visit is still the right step for farm-specific advice.
Public vs. request-only
Some products can be downloaded directly (like the CSA Training Manual and policy briefs in the Knowledge Hub); others require a request to the team.